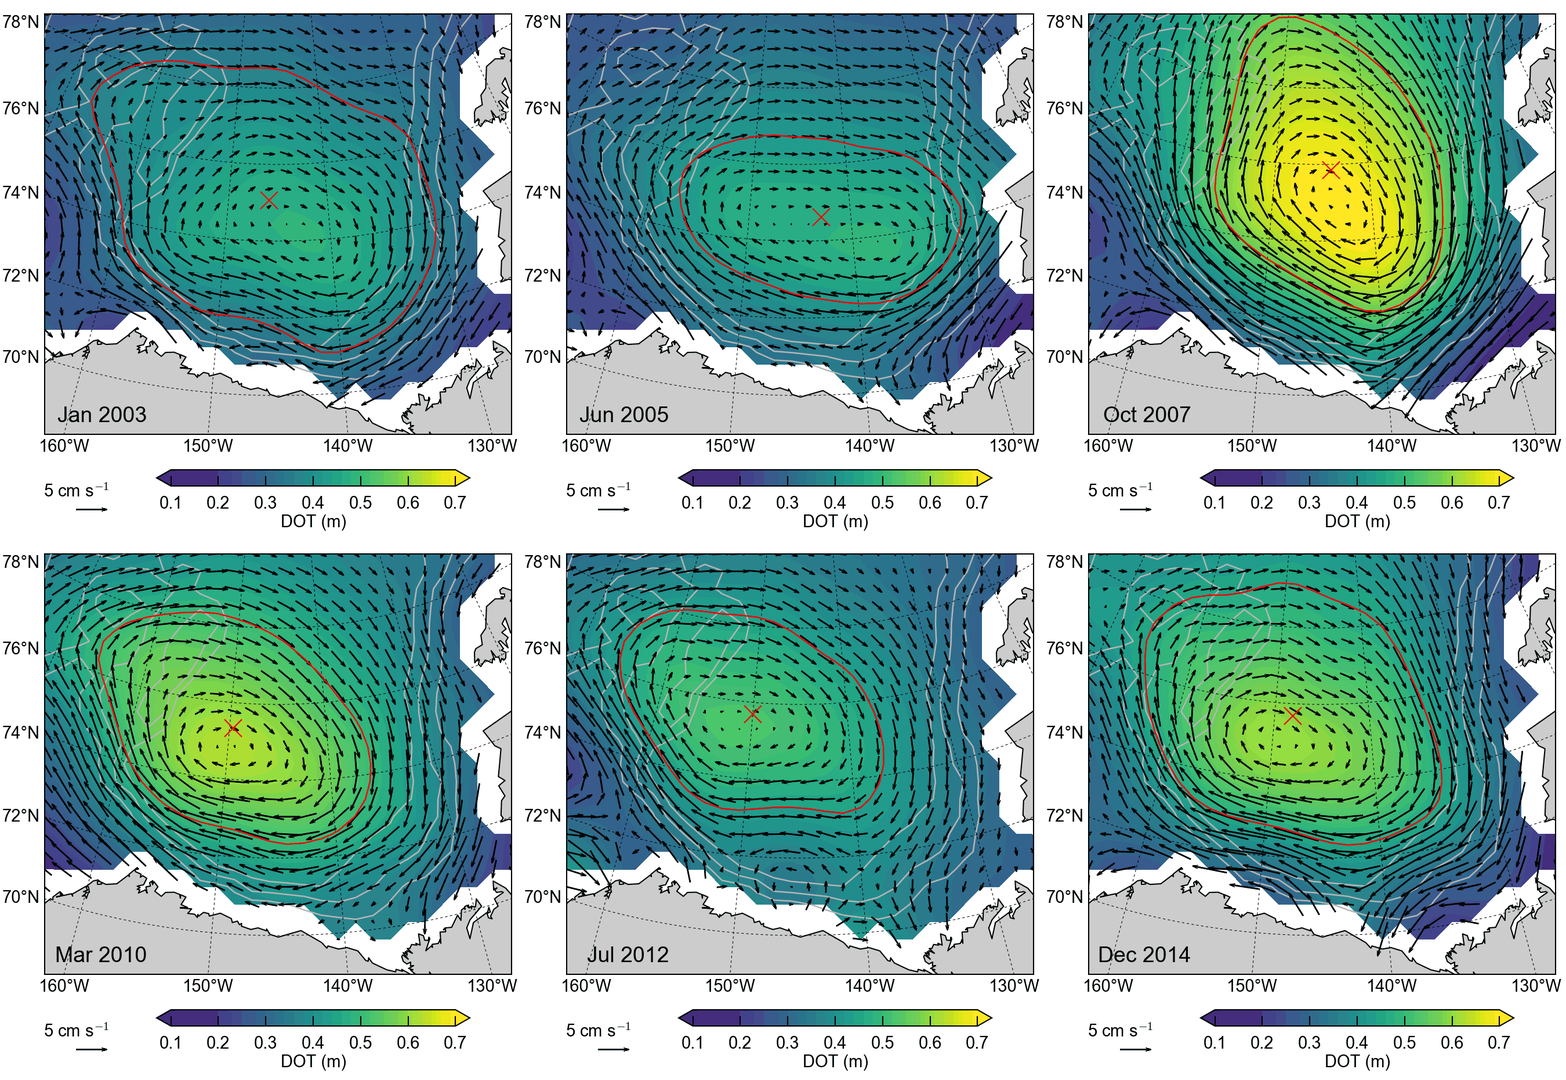
Arctic Ocean geostrophic circulation 2003-2014

Info
- Journal: The Cryosphere
- PDF: Armitage2017.pdf
- Supplement: Armitage2017.pdf
- doi: 10.5194/tc-2017-22
Citation
Armitage, T. W. K., S. Bacon, A. L. Ridout, A. A. Petty, S. Wolbach, and M. Tsamados (2017) Arctic Ocean geostrophic circulation 2003-2014, The Cryosphere, doi:10.5194/tc-2017-22.
Abstract
Monitoring the surface circulation of the ice-covered Arctic Ocean is generally limited in space, time or both. We present a new 12-year record of geostrophic currents at monthly resolution in the ice-covered and ice-free Arctic Ocean and characterise their seasonal to decadal variability from 2003-2014, a period of rapid environmental change in the Arctic. Geostrophic currents around the Arctic basin increased in the late '00s, with the largest increases observed in summer. Currents in the southeastern Beaufort gyre accelerated in late 2007 with higher current speeds sustained until 2011, after which they decreased to speeds representative of the period 2003-2006. The strength of the northwestward current in the southwest Beaufort gyre more than doubled between 2003 and 2014. This pattern of changing currents is linked to shifting of the gyre circulation to the northwest during the time period. The Beaufort gyre circulation and Fram Strait current are strongest in winter, modulated by the seasonal strength of the atmospheric circulation. Eddy kinetic energy is also larger in winter and we find high eddy activity congruent with features of the seafloor bathymetry. The variability of Arctic Ocean geostrophic circulation highlights the interplay between seasonally variable atmospheric forcing and ice conditions, on a backdrop of long term changes to the Arctic sea ice-ocean system. Studies point to various mechanisms influencing the observed increase in Arctic Ocean surface stress, and hence geostrophic currents, in the '00s – e.g. decreased ice concentration/thickness, changing atmospheric forcing, changing ice pack morphology – however more work is needed to refine the representation of atmosphere-ice-ocean coupling in models before we can fully attribute causality to these increases.

Bibtex
@article{armitage2017,
    AUTHOR = {Armitage, T. W. K. and Bacon, S. and Ridout, A. L. and Petty, A. A. and Wolbach, S. and Tsamados, M.},
    TITLE = {Arctic Ocean geostrophic circulation 2003-2014},
    JOURNAL = {The Cryosphere},
    VOLUME = {2017},
    YEAR = {2017},
    PAGES = {1--32},
    URL = {https://www.the-cryosphere-discuss.net/tc-2017-22/},
    DOI = {10.5194/tc-2017-22}
}